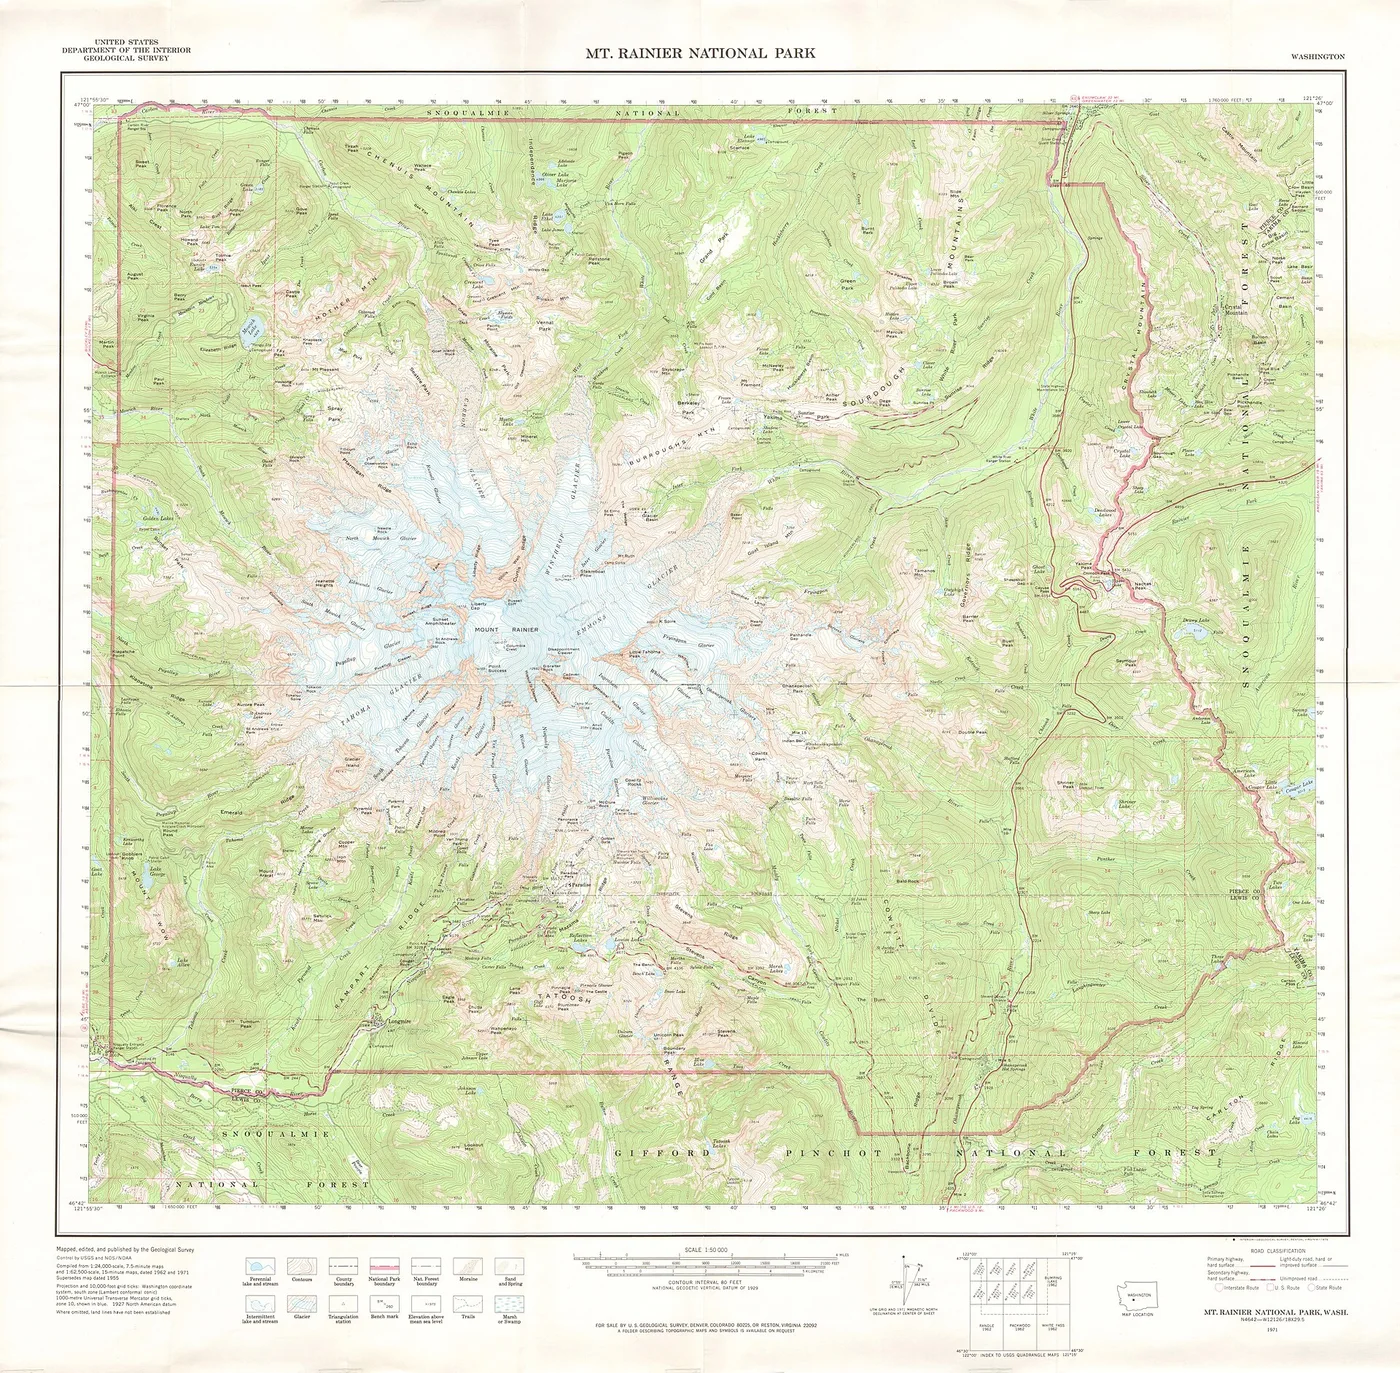
A topographic map does something remarkable: it turns the three-dimensional shape of a landscape into a pattern of lines that a reader can learn to see.
A map of height
Ordinary road maps emphasize routes and place names. Topographic maps describe the shape of the ground. Their signature feature is the contour line: a line joining points at the same elevation above a reference level, commonly mean sea level.
Every line has a particular height. The difference in height between neighboring contours is the contour interval. A map might use a 10-meter or 20-meter interval, for example; the map legend tells you which. That interval remains the same across a standard contour series on a given map.
The language of spacing
Where contour lines lie close together, the ground is steep. Where they spread apart, the slope is gentler. Closed loops often describe hills or depressions, and the shape of contours can reveal ridgelines, saddles, and valleys.
A stream crossing a valley often passes through V-shaped contours. The point of the V usually points uphill, toward the source. This simple clue can help you determine drainage direction even before a river is labeled.
Scale changes the story
Map scale expresses the relationship between a measured distance on paper and the equivalent distance on the ground. At 1:25,000, one centimeter represents 250 meters. A larger-scale map reveals more local detail, while a smaller-scale map covers a wider area at the cost of detail.
A good reader combines scale, contours, symbols, and the north arrow. A single feature can be easy to misread when removed from context, especially in rugged terrain.
Digital terrain, traditional ideas
Modern elevation models often begin with satellite observations, aerial imagery, lidar, or field surveys. Software can convert measured elevations into shaded relief, three-dimensional surfaces, and contour lines. The tools are digital, but the basic question remains unchanged: how can we represent a complex landscape clearly and accurately?
Practice with one small area. Locate its highest and lowest points, find a drainage route, and trace the gentlest ascent. Soon the lines start to feel less like decoration and more like terrain.
Further reading & references
These public educational resources informed the overview above. Image credits and reuse licences are listed on our sources page.
USGS — What is a topographic map? ↗USGS — Finding your way with map and compass ↗USGS — Topographic mapping ↗